Upload date
All time
Last hour
Today
This week
This month
This year
Type
All
Video
Channel
Playlist
Movie
Duration
Short (< 4 minutes)
Medium (4-20 minutes)
Long (> 20 minutes)
Sort by
Relevance
Rating
View count
Features
HD
Subtitles/CC
Creative Commons
3D
Live
4K
360°
VR180
HDR
328 results
Achieve deeper data analysis using operational tools and calculators within the Explore mode of Plotly Studio. Start using Plotly ...
115 views
4 weeks ago
Quickly connect your datasets on Databricks with Plotly and build a data app in minutes. All of this can be easily done with Plotly ...
66 views
8 days ago
Master Sankey Diagrams in Plotly for Powerful Data Visualization! Unlock the power of Sankey diagrams with Plotly!
32 views
1 day ago
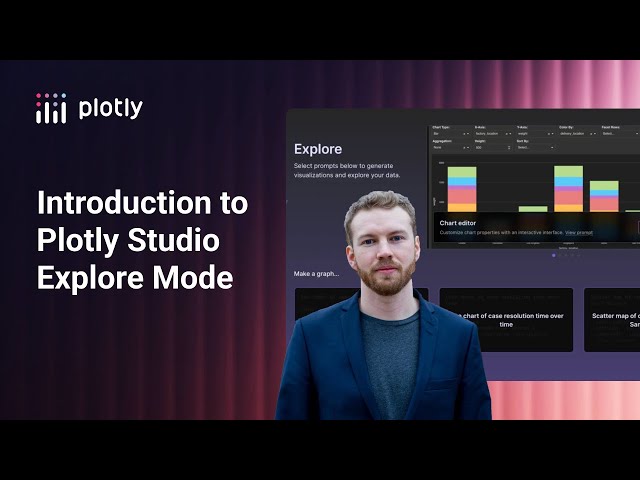
Learn about the new Explore mode, which auto generates suggested charts based off your datasets. All you have to do is select ...
169 views
Build a data app with AI, connect to your data sources and publish the app to the web in under 10 minutes. All of this can be done ...
137 views
2 weeks ago
Learn Plotly from scratch in this fast-paced, hands-on tutorial! In under 25 minutes, you'll master everything from basic bar charts ...
95 views
10 days ago
Welcome to the ultimate Plotly.js charting course! In this video series, you will learn how to create stunning, interactive, and ...
13 views
3 weeks ago
In this video, we'll explore how to enhance your scatter plots in Plotly by adding a single line to represent trends or specific data ...
0 views
7 days ago
This Jupyter Notebook explains how to use Python and Plotly to generate realistic synthetic data and build many different types of ...
70 views
9 views
Master Tree Maps in Plotly: From Tips to World Population! ✨ Unlock the power of tree maps with Plotly! In this Just Code It tutorial ...
26 views
In this video, we'll explore the powerful capabilities of Plotly for creating multiple subplots in your visualizations. Whether you're ...
Top Python Data Visualization Tools You Should Know Turn raw data into powerful insights with Python's most popular ...
4,724 views
In this video, we'll explore the essential steps to add a legend title in Plotly, a powerful graphing library for Python. Whether you're ...
In this tutorial, you'll learn how to create a smooth, dynamic, animated bar chart in Python using Plotly — one of the most powerful ...
4 views
Explore how to create meaningful and interactive data visualizations using Plotly in Python. This instructional session provides a ...
5 days ago
I asked AI for “satisfying math curves” and let it do everything. It didn't just spit out formulas – it actually wrote the code, used tools ...
68 views
13 days ago
You asked and we delivered! Plotly Studio - your shortcut to the world of vibe analytics - just received a host of new capabilities for ...
57 views
6 days ago
This instructional video provides a comprehensive introduction to using Plotly, a powerful tool for creating interactive data ...
5 views
16 views