Upload date
All time
Last hour
Today
This week
This month
This year
Type
All
Video
Channel
Playlist
Movie
Duration
Short (< 4 minutes)
Medium (4-20 minutes)
Long (> 20 minutes)
Sort by
Relevance
Rating
View count
Features
HD
Subtitles/CC
Creative Commons
3D
Live
4K
360°
VR180
HDR
814 results
ai #python #codanics #artificialintelligence #urdu This complete course is being uploaded here: ...
1,671 views
2 years ago
In this video you will learn about how visualize data by using #plotly. Plotly is the best tool in Python for #datavisualization.
22,057 views
6 years ago
Try CodeCrafters for free using my referral link: https://app.codecrafters.io/join?via=trentpark8800 Welcome to this ...
13,601 views
1 year ago
Subscribe to Ave Tech: https://www.youtube.com/channel/UCIViq3TOQY6eTefhEJA9JEw?sub_confirmation=1 Subscribe to Ave ...
631 views
4 years ago
Video Description: Master Data Visualization with Python: From Beginner to Advanced! In this comprehensive Data ...
34,639 views
You start the morning exploring some data in a Jupyter notebook with Plotly Express and after lunch you whip up a web ...
24,634 views
ai #python #codanics #artificialintelligence #urdu We will cover this: https://codanics.com/data-visualization-in-data-science/ This ...
6,341 views
Streamed 2 years ago
62 views
3 years ago
In this tutorial, you'll learn about how to Data Visualization by using Plotly. Plotly is the best tool in Python for Data Visualization.
152 views
This tutorial teaches how to use the Plotly library in Python to perform Data visualizations. Recording and Tutorial was made by ...
701 views
5 years ago
This video loads US Census data related to car ownership ("vehicles available by tenure") into a padas DataFrame. Shows you ...
66 views
1,363 views
Learn to build interactive charts with Plotly, Python and Power BI. Learn to create various types of Data Visualization charts using ...
11,673 views
Stephan Heunis about how to visualize your data interactively and how to deploy a Dash app to let others interact with your data ...
121 views
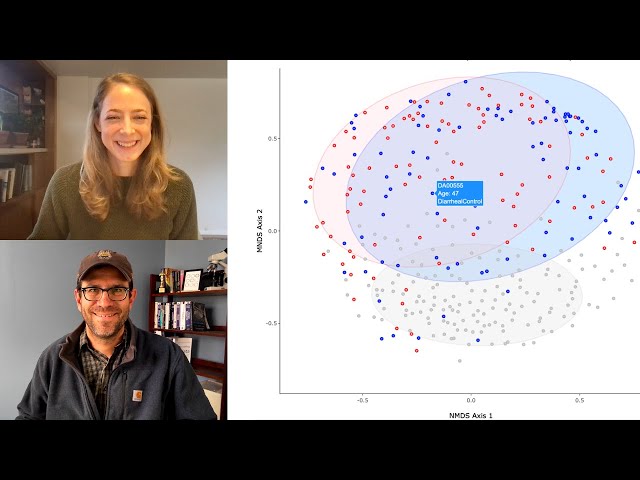
Sarah Lucas joins Pat Schloss to give him a tutorial on how to use the plotly R package to add interactivity to a scatter plot he ...
6,564 views
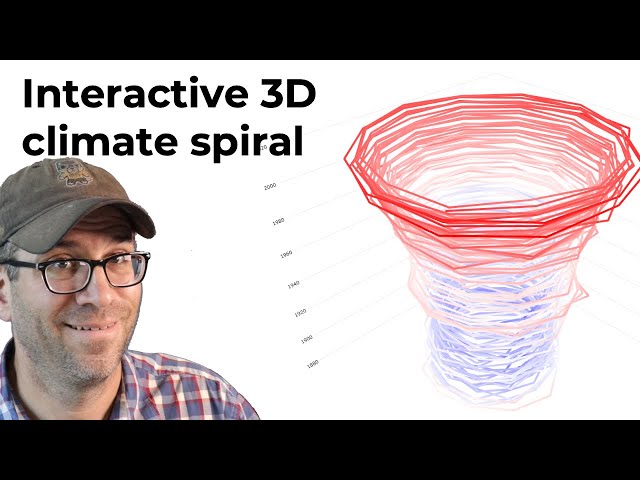
Pat will show you how to visualize climate change in R with a 3D interactive climate spiral using the plotly package. This will all be ...
2,605 views
3,760 views
In this Data Visualization with Python tutorial, you'll learn how to build interactive charts with Plotly and Python. You'll learn ...
2,777 views
Building a web application for elderly and caregiver wellness with Python, Django, and Plotly Express.
1,742 views
Streamed 3 years ago
1,539 views