Upload date
All time
Last hour
Today
This week
This month
This year
Type
All
Video
Channel
Playlist
Movie
Duration
Short (< 4 minutes)
Medium (4-20 minutes)
Long (> 20 minutes)
Sort by
Relevance
Rating
View count
Features
HD
Subtitles/CC
Creative Commons
3D
Live
4K
360°
VR180
HDR
154 results
A behind-the-scenes look at how I animate videos. Code for all the videos: https://github.com/3b1b/videos Manim: ...
2,646,158 views
1 year ago
To try everything Brilliant has to offer—free—for a full 30 days, visit https://brilliant.org/ArtemKirsanov/ The first 200 of you will get ...
891,966 views
2 years ago
A bar chart race, also known as a bar chart animation or a bar chart race animation, is a data visualization technique that shows ...
6,094 views
Most of us have heard the saying, "A picture is worth a thousand words," but a movie builds context and a story, especially when ...
1,283 views
3 years ago
Speaker: Reshama Shaikh Plotly is a versatile, open-source python graphing library which lets us make interactive graphs.
104 views
4 years ago
In the field of astronomy and astrophysics, data cubes are fundamental tools for analyzing three-dimensional data sets that ...
253 views
We have prepared a video tutorial about Matplotlib, which is a plotting library for the Python programming language and ...
657 views
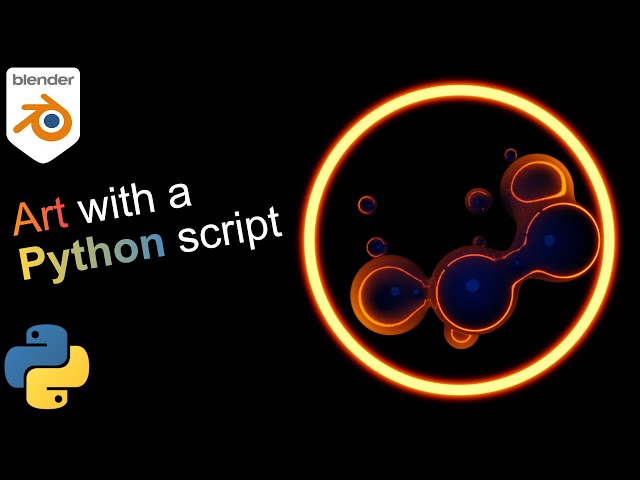
Struggling with Python in Blender? Go here: https://cgpython.com/skool/97 In this video, we will create a script that generates an ...
11,678 views
A data cube in astronomy is a three-dimensional array of data, where two of the dimensions correspond to spatial information (like ...
380 views
Welcome to the ivirazka channel, your one-stop destination for mastering Python for data analysis. Whether you're a beginner ...
12 views
You guys can help me out over at Patreon, and that will help me keep my gear updated, and help me keep this quality content ...
142,183 views
Want help automating Blender with Python? Go here: https://cgpython.com/skool/78 In this video, we will create a script that ...
9,071 views
Python Notebooks are great for communicating data analysis & research but how do you port these data visualizations between ...
2,335 views
5 years ago
Pyplot, Plot, Sine function.
511 views
Today, I am going to show you how to create the famous simulation known as "Conway's Game of Life", a cellular automation ...
46,955 views
Thanks to Mailgun for sponsoring this video! Try Mailgun today by using my link https://mailgun.com/techwithtim Recently this ...
38,494 views
Wavelet transform is an invaluable tool in signal processing, which has applications in a variety of fields - from hydrodynamics to ...
743,116 views
In this presentation, we'll take a look at what it takes to generate fundamental chart types using SAS (ODS Graphics), R (ggplot2) ...
2,695 views
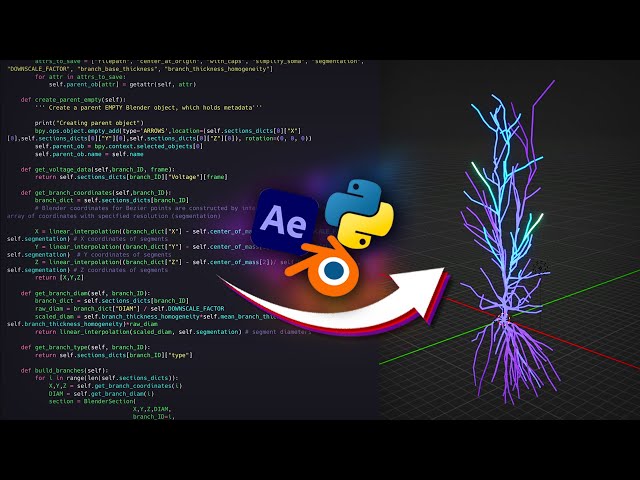
Struggling with Python in Blender? Go here: https://cgpython.com/skool/89 In this video, we will create a script that generates an ...
9,299 views
Python is used for a wide variety of software projects. One area it's really gained a huge amount of momentum is in the ...
1,616 views
Streamed 2 years ago