Upload date
All time
Last hour
Today
This week
This month
This year
Type
All
Video
Channel
Playlist
Movie
Duration
Short (< 4 minutes)
Medium (4-20 minutes)
Long (> 20 minutes)
Sort by
Relevance
Rating
View count
Features
HD
Subtitles/CC
Creative Commons
3D
Live
4K
360°
VR180
HDR
274 results
You can find my blog post about animations with Matplotlib here: ...
22,130 views
6 years ago
In this video, we'll dive into the exciting world of data visualization using Plotly in Python. You'll learn how to create an engaging ...
13 views
3 months ago
An introduction to the matplotlib.pyplot plotting package in Python Full course at: http://idl.utsa.edu/me5013.
1,356 views
13 years ago
... matplotlib the entire idea is that we take all of the numbers and analysis and data that we are getting when we're using Python ...
1,143 views
5 years ago
In this series I explain how animation works and how to code animated sprites in Python 3 using the Turtle Module. All code and ...
79,838 views
Michel Henon in 1976 introduced the Henon function which describes a transformation rule for a point x, y as follows: x1, y1 maps ...
1,758 views
10 years ago
Step into the world of advanced atmospheric data analysis in the sixth part of our tutorial series. We guide you through the process ...
806 views
3 years ago
Learn how to use regular expression using re method. In this tutorial, Python re method used are search(), findall(), match(), sub(), ...
1,666 views
4 years ago
ai #python #codanics #artificialintelligence #urdu This complete course is being uploaded here: ...
964 views
2 years ago
for code, github link: https://github.com/Rohit03111994/Machine-Learning-Project/blob/master/Data_Visualisation_I.ipynb Explore ...
192 views
... um you can see that i'm importing uh matplotlib already uh from matplotlib.animation i'm importing funk animation uh and then ...
281 views
msratanagarwal #matplotlib #python How To Plot Line Graph In Python using matplotlib what about the video? How To Plot Line ...
42 views
Full course at: http://johnfoster.pge.utexas.edu/PGE323M-ResEngineeringIII/course-mat.
1,017 views
8 years ago
This video is about plotting images, errorbars, histograms, and composite plots using matplotlib in the Jupyter notebook.
287 views
7 years ago
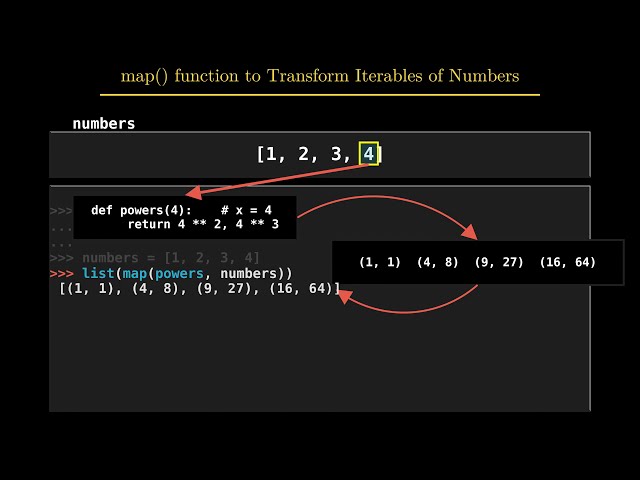
Learn about map() function and different types of useful tips for map function. Timeline: Tips to use 0:04 Built-In function with map ...
522 views
16,663 views
This video animates the execution of a short Python program that identifies user input as being a palindrome or not. Viewers can ...
2,406 views
In this video I show how to measure and visualize the GPU power usage with a single Python program in real time. You can find ...
744 views
9,068 views
Hello today I might be talking about how we can make visual and animations in Python using that plant web it turns out that ...
247 views