Upload date
All time
Last hour
Today
This week
This month
This year
Type
All
Video
Channel
Playlist
Movie
Duration
Short (< 4 minutes)
Medium (4-20 minutes)
Long (> 20 minutes)
Sort by
Relevance
Rating
View count
Features
HD
Subtitles/CC
Creative Commons
3D
Live
4K
360°
VR180
HDR
4,202,056 results
Learn how to create and interact with plots in MATLAB®, which is an important part of creating MATLAB code. Anyone – from ...
44,669 views
6 years ago
A brief example on how to use MATLAB to plot multiple functions on the same figure, declare time vectors and step sizes, label x ...
82,144 views
7 years ago
I hope this will be helpful for you :)
128,370 views
You can interactively create and explore visualizations for your data with the Create Plot Live Editor task. Choose visualizations ...
6,500 views
4 years ago
How to Plot a Histogram in MATLAB! Create a histogram using the histogram() function and set the number of bins. Simple plotting ...
6,841 views
3 years ago
Learn how to create MATLAB plots interactively. If you know exactly how you want to visualize your data, simply select/highlight it ...
6,106 views
1 year ago
Learn how to use tiledlayout to create subplots in MATLAB. tiledlayout creates a tiled chart layout for displaying multiple plots in ...
28,340 views
5 years ago
How to Make a 2D Scatter Plot in MATLAB! Change datapoint size and color, in addition to plotting on the x and y axis.
8,927 views
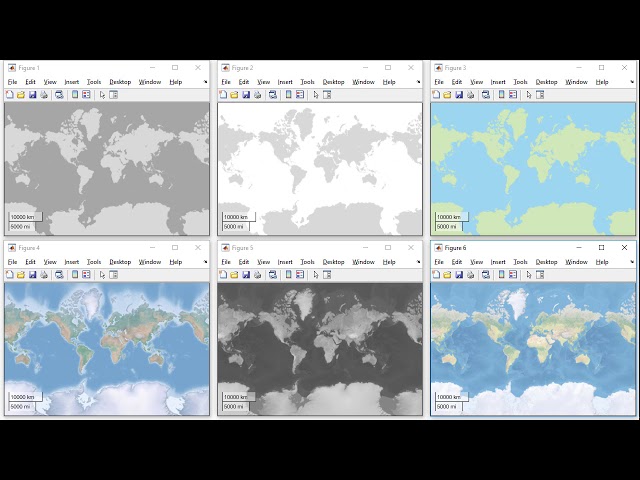
MATLAB® makes it easy to plot data on top of a geographic basemap inside a MATLAB figure. Learn how you can use ...
31,904 views
MATLAB Plotting LogLog & SemiLog.
33,375 views
8 years ago
This video lets you know about 2d and 3d plots in matlab.For more info visit https://www.matlabsolutions.com/
391 views
Learn how to create Bar Plot in MATLAB.
10,550 views
... plot and then the name of it so once again to navigate through a matrix in MATLAB I'm going to type 1 comma colon and that will ...
3,175 views
matlab #plot #plots #video #animation.
269 views
Creating a 3D surface plot in MATLAB is simple and useful for data visualization. #matlab #script In this example, I used the ...
654 views
1 month ago
Illustrates how to create a plot from data points in three-dimensional space outlining the path of an object. Get a free product Trial: ...
15,904 views
We take a look at the code used to plot different portions of this infinite figure we call the Mandelbrot set. Narrated by yours truly.
1,468 views
http://allaboutee.com Learn to make a bode plot out of a transfer function in MATLAB.
15,448 views
14 years ago
Learn step-by-step how to plot a Bode diagram in Simulink using MATLAB, from version 2017 to the latest release! This tutorial ...
3,760 views
Illustrates how to create a graph in MATLAB using a set of data points. Get a free product Trial: https://goo.gl/ZHFb5u Learn more ...
5,287 views