Upload date
All time
Last hour
Today
This week
This month
This year
Type
All
Video
Channel
Playlist
Movie
Duration
Short (< 4 minutes)
Medium (4-20 minutes)
Long (> 20 minutes)
Sort by
Relevance
Rating
View count
Features
HD
Subtitles/CC
Creative Commons
3D
Live
4K
360°
VR180
HDR
2,458 results
Matplotlib shortcut every Python programmer and Data Scientist needs to know! Learn how to effortlessly style your plots with ...
496 views
1 year ago
This video will show you how to control the Matplotlib legend size by controlling the font size used in the legend.
506 views
2 years ago
In this lesson, learn what is Matplotlib with its features. Matplotlib is an open-source plotting library developed by John D. Hunter.
23,917 views
... your questions in the comments below, which I will definitely upload videos for frequently asked questions. my matplotlib tutorial ...
540 views
5 years ago
This video will show how to control what color each plot is when using Matplotlib.
507 views
Use the axes to add titles to each subplot in Matplotlib.
280 views
In this short video, I show you how to create a plot on a logarithmic axis in Matplotlib. You can grab the current axis with plt.gca().
504 views
Tutorial on How to plot Stock Candlestick Chart with 2 lines of Code in Python. In this video we will use plotly module (package) in ...
1,072 views
3 years ago
Matplotlib python #short #tutorial - on basics of creating bar chart which is best suited for comparing categorical data.
234 views
Hang out to the end for the "one click" solution... More savefig options: ...
14,995 views
Find Complete Code at GeeksforGeeks Article: http://www.geeksforgeeks.org/graph-plotting-in-python-set-1/ This video is ...
9,594 views
8 years ago
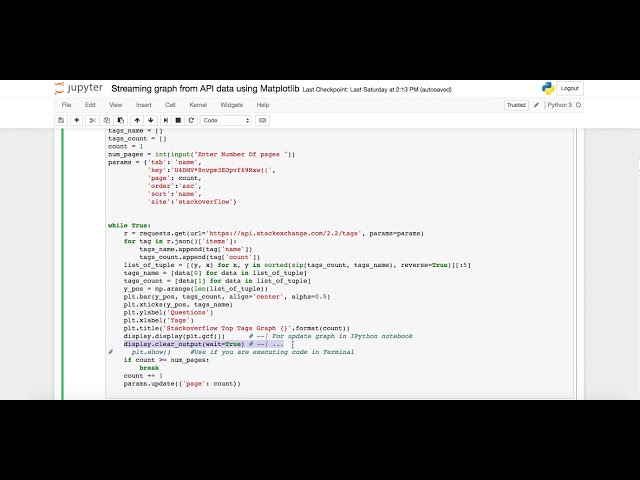
It'll show streaming of data from API data and creating graph using matplotlib library. It's simple demo to understand way of ...
639 views
Tutorial on plotting a bar chart (bar plot or bar graph) in matplotlib in Python programming language + example [from scratch in ...
874 views
In order to control what range is shown on your Matplotlib plot, you have to grab the current axes using plt.gca(). Then use this ...
339 views
Previously, I provided a conceptual overview of likelihood methods and model estimation: ...
8,624 views
This video shows how to install matplotlib in Python 3.13.3. It will walk you through, step-by-step, how to install matplotlib on ...
50 views
6 months ago
In this quick video, we'll show you how to add a legend to a Matplotlib plot. This is a quick and easy way to improve the ...
235 views
This video shows how to install matplotlib on Python 3.14.2 It will walk you through, step-by-step, how to install matplotlib on ...
23 views
12 days ago
In this video I have used Matplotlib to bring out the difference between Stochastic and Batch Gradient Descent which are ...
2,582 views
6 years ago
In this video, we'll show you how to control the font size of your ticks in Matplotlib. By adjusting the font size, you can control the ...
197 views