ViewTube

ViewTube
Sign inSign upSubscriptions
Filters

Upload date

Type

Duration

Sort by

Features

Reset

981 results

The Code City
How to Install Matplotlib in Python for Data Plotting in VSCode (2026)

Buy me a coffee: https://www.buymeacoffee.com/thecodecity Your plots aren't working because Matplotlib isn't installed correctly.

1:27
How to Install Matplotlib in Python for Data Plotting in VSCode (2026)

117 views

6 days ago

PyPlus
How to Plot Data Automatically in Python Using Matplotlib

Want to automate your data plotting in Python? In this quick tutorial, I show you how to use Matplotlib to create a clean and simple ...

2:36
How to Plot Data Automatically in Python Using Matplotlib

0 views

10 days ago

Learn_By_Seeing
Line Chart in Python Using Matplotlib | Simple Beginner Example

Line Chart in Python Using Matplotlib | Simple Beginner Example YouTube Description In this video, you will learn how to ...

0:19
Line Chart in Python Using Matplotlib | Simple Beginner Example

24 views

6 days ago

AI Evolutionary
How to Create Gridlines in Python Plots  | Matplotlib Guide

How to Create Gridlines in Python Plots Matplotlib Guide In this video, you will learn how to create gridlines in Python using ...

0:53
How to Create Gridlines in Python Plots | Matplotlib Guide

37 views

2 days ago

Creative Notes
Types of plots in Matplotlib | Matplotlib Histograms | Creative Notes #python #matplotlib #histogram
3:00
Types of plots in Matplotlib | Matplotlib Histograms | Creative Notes #python #matplotlib #histogram

66 views

12 days ago

Dive in Data
Even–Odd in Just TWO Lines! Python Trick You Must Know #coding #programminglanguage #python

Here you will learn the new-edge technologies like Data Science, Machine Learning, SQL, Python, Power BI, Tableau, and other ...

1:43
Even–Odd in Just TWO Lines! Python Trick You Must Know #coding #programminglanguage #python

1,463 views

1 month ago

Aadity Kush X Code
Matplotlib Figure Explained

Matplotlib Figure Explained In this video, you will learn how to create a figure in Matplotlib using plt.figure() and plt.subplots().

2:03
Matplotlib Figure Explained

15 views

4 weeks ago

Tech Keys X
V   S1 EP9 T2   Machine Learning in Python   Cyber Punk Sytle Graphs   with Matplotlib

V - S1 EP9 T2 - Machine Learning in Python - Cyber Punk Sytle Graphs - with Matplotlib #dataengineering ...

2:19
V S1 EP9 T2 Machine Learning in Python Cyber Punk Sytle Graphs with Matplotlib

1,059 views

3 weeks ago

Tech Lync
🚀 Become a Data Scientist | Python, Machine Learning, AI & Projects | Tech Lync

Looking to build a career in Data Science? Tech Lync's industry-ready Data Science program helps you master AI, machine ...

1:11
🚀 Become a Data Scientist | Python, Machine Learning, AI & Projects | Tech Lync

16 views

4 days ago

Tech Keys X
V   S1 EP9 T1   Machine Learning in Python   Dark Mode Graphs   with Matplotlib Easily

Machine Learning S1 EP8 with Captions #vscode #python #jupyternotebook #mlforbeginners #machinelearning #learnpython ...

2:10
V S1 EP9 T1 Machine Learning in Python Dark Mode Graphs with Matplotlib Easily

392 views

3 weeks ago

Creative Notes
Types of plots in Matplotlib | Matplotlib Bar chart | Creative Notes #python #matplotlib
3:00
Types of plots in Matplotlib | Matplotlib Bar chart | Creative Notes #python #matplotlib

0 views

2 weeks ago

Tech Keys X
V   S1 EP9 T6   Machine Learning in Python   Plotting on Subplots   with Matplotlib

V - S1 EP9 T6 - Machine Learning in Python - Plotting on Subplots - with Matplotlib #learnpython #PythonForDataScience ...

2:10
V S1 EP9 T6 Machine Learning in Python Plotting on Subplots with Matplotlib

1,041 views

3 weeks ago

Tech Keys X
V   S1 EP9 T4   Machine Learning in Python   Subplots Layout   with Matplotlib

V - S1 EP9 T4 - Machine Learning in Python - Subplots Layout - with Matplotlib #algorithims #machinelearningbasics ...

2:31
V S1 EP9 T4 Machine Learning in Python Subplots Layout with Matplotlib

635 views

3 weeks ago

TechnicallyRipped
Creating Spectograms With Python | Python Tutorial

Learn how to turn any audio file into a spectrogram using Python. This quick tutorial shows you how to load audio data, interpret ...

1:01
Creating Spectograms With Python | Python Tutorial

1,674 views

9 days ago

Tech Keys X
V   S1 EP9 T5   Machine Learning in Python   Canvas Size and Multiple   Plots with Matplotlib

V - S1 EP9 T5 - Machine Learning in Python - Canvas Size and Multiple - Plots with Matplotlib #machinelearningmodels ...

2:33
V S1 EP9 T5 Machine Learning in Python Canvas Size and Multiple Plots with Matplotlib

506 views

3 weeks ago

Great Learning
Learn Data Science & Machine Learning with Python

Learn data science and machine learning using Python. Master essential libraries like NumPy, Pandas, and Seaborn for data ...

0:47
Learn Data Science & Machine Learning with Python

1,850 views

12 days ago

Tech Keys X
V   S1 EP9 T9   Machine Learning in Python   Nice Grid Layout   with Matplotlib

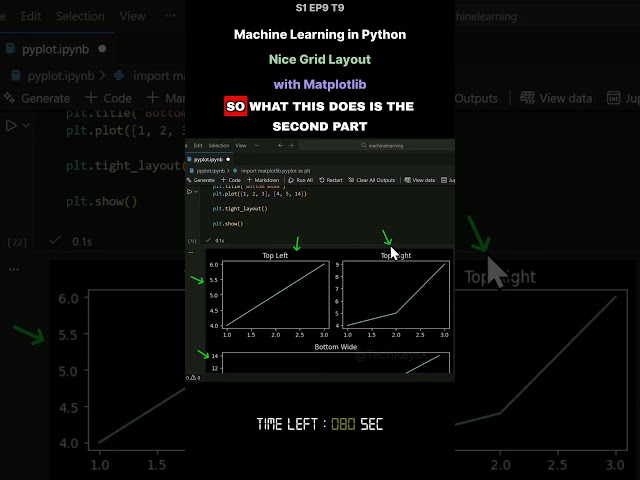
V - S1 EP9 T9 - Machine Learning in Python - Nice Grid Layout - with Matplotlib #aiexplained #machinelearningmodels ...

2:44
V S1 EP9 T9 Machine Learning in Python Nice Grid Layout with Matplotlib

108 views

2 weeks ago

PYAI HUB
how to visualise charts in python,  🚀 just  60sec #coding #pyaihub #education #programming #python

Check out this Python project from my PyAI Hub repository! This short demonstrates data visualization using Matplotlib. Perfect for ...

0:55
how to visualise charts in python, 🚀 just 60sec #coding #pyaihub #education #programming #python

65 views

11 days ago

AANUPOM ROY
Matplotlib install in python
0:14
Matplotlib install in python

0 views

3 weeks ago

Enlighter Tech
AI, Machine Learning & Data Science Full Course | Python Training for Beginners | Enlighter Tech

Build your career in Artificial Intelligence, Machine Learning, and Data Science with Enlighter Tech's industry-focused training ...

0:31
AI, Machine Learning & Data Science Full Course | Python Training for Beginners | Enlighter Tech

17 views

11 days ago