ViewTube

ViewTube
Sign inSign upSubscriptions
Filters

Upload date

Type

Duration

Sort by

Features

Reset

4,077 results

Riffomonas Project
Fitting and visualizing linear regression models with the ggplot2 R package (CC237)

geom_smooth from the ggplot2 R can fit linear regression models through your data, but what if you want the coefficients or you ...

22:50
Fitting and visualizing linear regression models with the ggplot2 R package (CC237)

8,957 views

3 years ago

Riffomonas Project
Creating a stacked bar plot infographic from Our World in Data in R with ggplot2 (CC381)

Pat recreates a stacked barplot that has an inforgraphic feel to it from Our World in Data. Aside from the stacked bar plot, he also ...

2:29:35
Creating a stacked bar plot infographic from Our World in Data in R with ggplot2 (CC381)

487 views

Streamed 1 month ago

The GRAPH Courses
Lines, scales and labels | Data on display: visualizing data with ggplot2 in R (lesson 3)

FURTHER RESOURCES Get the data, scripts, PDF notes and quizzes for this lesson from our website: ...

40:14
Lines, scales and labels | Data on display: visualizing data with ggplot2 in R (lesson 3)

879 views

2 years ago

Riffomonas Project
Running non-metric multidimensional scaling (NMDS) in R with vegan and ggplot2 (CC187)

Non-metric multidimensional scaling (NMDS) is an alternative to principle coordinates analysis (PCoA) and its relative, principle ...

12:29
Running non-metric multidimensional scaling (NMDS) in R with vegan and ggplot2 (CC187)

35,783 views

3 years ago

Riffomonas Project
How to combine map and patchwork to make facets of facets with ggplot2 in R (CC387)

Pat refactors a set of panels from a horizontal to vertical orientation using a combination of facet_wrap and patchwork with the ...

1:45:40
How to combine map and patchwork to make facets of facets with ggplot2 in R (CC387)

804 views

Streamed 3 weeks ago

Riffomonas Project
Replacing a stacked bar plot with a dot plot in R with ggplot2 (CC352)

Pat uses R to show how to create a dot plot as an alternative to stacked bar plots like the one posted by the Pew Research Center ...

32:21
Replacing a stacked bar plot with a dot plot in R with ggplot2 (CC352)

1,060 views

9 months ago

Riffomonas Project
Creating a broken x-axis using only the ggplot2 package in R (CC316)

Pat shows how to use annotate() and other functions from ggplot2 to create a break in the x-axis of a dot plot with error bars that ...

34:17
Creating a broken x-axis using only the ggplot2 package in R (CC316)

2,598 views

1 year ago

Riffomonas Project
Using the new ggplot2 and Positron to recreate a bar plot from the Washington Post (CC371)

Pat recreates a figure from the Washington Post that has a series of titled bar plots that are part of a single figure. He shows a ...

1:57:03
Using the new ggplot2 and Positron to recreate a bar plot from the Washington Post (CC371)

1,145 views

Streamed 2 months ago

Riffomonas Project
Visualizing correlation with double y-axes using the ggplot2 R package (CC235)

Should you visualize your data using double y-axes? In this Code Club, Pat will show how to assess correlations using ggplot2 ...

24:18
Visualizing correlation with double y-axes using the ggplot2 R package (CC235)

9,150 views

3 years ago

Riffomonas Project
Creating bar plot with error bars using ggplot2's stat_summary in R (CC318)

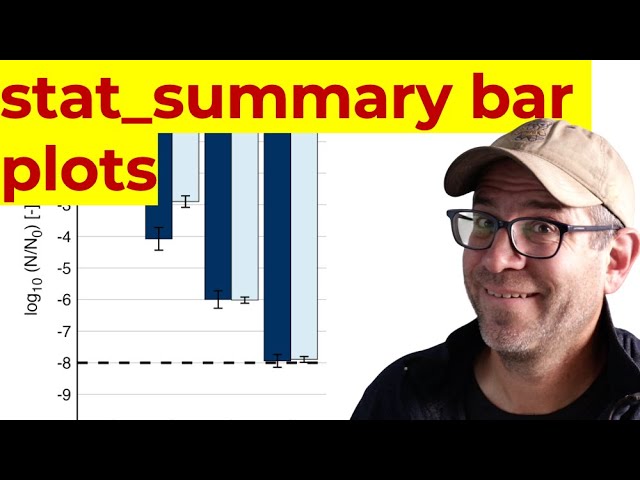
Pat shows how to use stat_summary() and other functions from ggplot2 to create a descending barplot with error bars in R. He ...

34:14
Creating bar plot with error bars using ggplot2's stat_summary in R (CC318)

1,441 views

1 year ago

Riffomonas Project
Using ggplot2 to visualize changes in US sentiment towards Israelis/Palestenians (CC363)

Pat recreates a line plot from Philip Bump showing the change in sentiment among Americans towards Israelis and Palestinians ...

1:45:05
Using ggplot2 to visualize changes in US sentiment towards Israelis/Palestenians (CC363)

940 views

Streamed 5 months ago

Riffomonas Project
Creating a beeswarm plot in R with ggplot2 using several approaches (CC368)

A beeswarm plot is kind of like a jittered plot, kind of like a sina plot, and kind of like a dotplot. What are those and how do you ...

1:53:42
Creating a beeswarm plot in R with ggplot2 using several approaches (CC368)

839 views

Streamed 3 months ago

Riffomonas Project
How to create a grouped bar chart in R with ggplot2's geom_col and position_dodge functions (CC107)

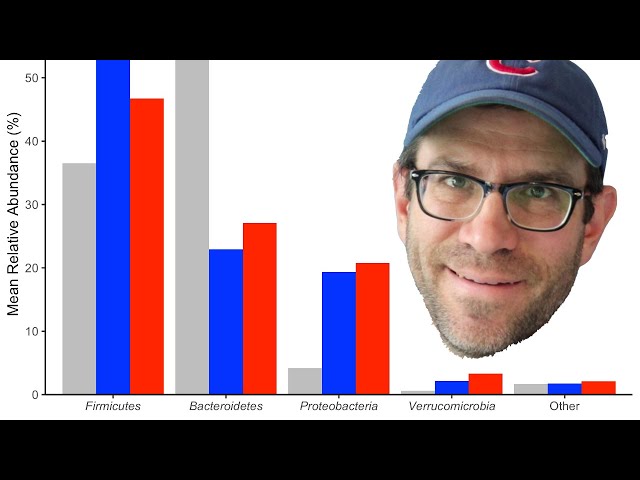
A grouped bar chart plot can be an effective way to represent the variation across a continuous variable for multiple levels of two ...

24:56
How to create a grouped bar chart in R with ggplot2's geom_col and position_dodge functions (CC107)

35,418 views

4 years ago

Riffomonas Project
Using ggplot2 to make a faceted bar plot that you can't tell has facets (CC370)

Pat recreates a figure from the New York Times that has a series of titled bar plots that are part of a single figure. He shows a ...

1:25:06
Using ggplot2 to make a faceted bar plot that you can't tell has facets (CC370)

762 views

Streamed 3 months ago

Riffomonas Project
Adding lines and asterisks of statistical significance on a figure with ggplot2 (CC093)

Have you ever wondered how to add lines with asterisks to denote statistical significance on a plot you've made with ggplot2?

19:47
Adding lines and asterisks of statistical significance on a figure with ggplot2 (CC093)

21,843 views

4 years ago

Riffomonas Project
Creating stacked area plots with ggplot2 and patchwork (CC372)

Pat recreates a figure from the Financial Times that has two area plots. He decided to use the patchwork package to recreate this ...

2:56:19
Creating stacked area plots with ggplot2 and patchwork (CC372)

935 views

Streamed 2 months ago

Riffomonas Project
Positron or RStudio? First time Positron user creates scatter plot with R's ggplot2 package (CC333)

Pat installs and uses Positron for the first time to recreate a visualization generated from the gapminder dataset. He compares ...

42:12
Positron or RStudio? First time Positron user creates scatter plot with R's ggplot2 package (CC333)

6,824 views

11 months ago

The GRAPH Courses
Scatterplots and smoothing | Data on display: visualizing data with ggplot2 in R (lesson 2)

LESSON MATERIALS Get the data, scripts, PDF notes and quizzes for this lesson from our website: ...

33:04
Scatterplots and smoothing | Data on display: visualizing data with ggplot2 in R (lesson 2)

494 views

2 years ago

Dr. Lindsay Waldrop
L2.5 – Grammar of Graphics (ggplot2 package)

Tenth in a series of lectures introducing students to R programming language. In this lecture, these topics are covered: - The ...

36:13
L2.5 – Grammar of Graphics (ggplot2 package)

146 views

4 years ago

Riffomonas Project
Using stat_summary from ggplot2 to add a statistics layer to plots in R (CC089)

Ever wonder what all of those stats functions do in ggplot2? In this episode of Code Club, Pat shows how you can use stat ...

21:09
Using stat_summary from ggplot2 to add a statistics layer to plots in R (CC089)

14,453 views

4 years ago