Upload date
All time
Last hour
Today
This week
This month
This year
Type
All
Video
Channel
Playlist
Movie
Duration
Short (< 4 minutes)
Medium (4-20 minutes)
Long (> 20 minutes)
Sort by
Relevance
Rating
View count
Features
HD
Subtitles/CC
Creative Commons
3D
Live
4K
360°
VR180
HDR
852 results
Here's my multi Claude Code workflow with voice input, showing how to process and visualize data with Python and a bit of ...
2,110 views
14 hours ago
While most machine learning tutorials and challenges focus on single-table datasets, real-world enterprise data is often ...
242 views
5 days ago
Most data science projects start with a simple notebook—a spark of curiosity, some exploration, and a handful of promising results ...
124 views
6 days ago
The default color space for computers includes over 16 million colors—an embarrassment of riches that is also a potential ...
152 views
In this hands-on session, you will learn how to create clear and effective data visualizations using Python. The focus is on turning ...
37 views
17 hours ago
This tutorial provides a comprehensive introduction to using the Seaborn library for statistical data visualization in Python.
7 views
matplotlib #seaborn #plotly #piecharts #scatterplot #barplot #whiskerboxplot #boxplot #histograms #kde #pairplot #violinplot ...
279 views
In this video, I walk through a real Python for Business Analysis project using a retail sales dataset. We start with a high-level ...
8 views
sayyednasarali #DataVisualization #Python #Matplotlib #Seaborn #DataScience #BeginnerPython #SchoolLevel #PythonTutorial ...
49 views
3 days ago
When I saw that Day 16 of the #30DayMapChallenge 2025 was themed “Cell,” I decided to explore small-scale spatial resolution, ...
214 views
Seaborn and Matplotlib are two of the most popular Python libraries for data visualization — but they serve different purposes.
0 views
18 hours ago
Welcome to the Python for AI Series! In this video, we'll cover the core Python concepts every AI and Machine Learning beginner ...
Explore how to create meaningful and interactive data visualizations using Plotly in Python. This instructional session provides a ...
4 views
In Part 2 of this Python Course for AI and Data Science 2026, you will learn Python operators and user input in a clear, beginner ...
136 views
What does the JupyterLab extension ecosystem actually look like in 2025? While extensions drive much of JupyterLab's practical ...
81 views
Welcome to Data world! In this video, you'll learn Python for Data Science (2026 roadmap) — from absolute beginner to advanced ...
9 views
You're already using AI coding assistants for more than autocomplete, but are you using them effectively? This talk presents ...
84 views
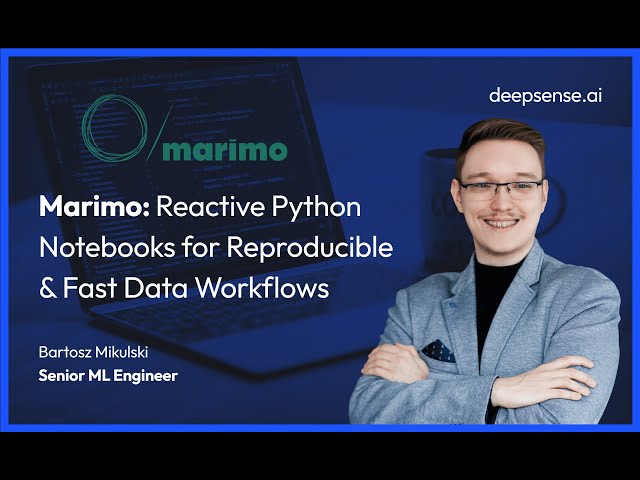
Marimo positions itself as next-generation Python notebooks — reactive, reproducible, and engineered for modern data workflows ...
39 views
The ROOT software framework is widely used from Python in HEP for storage, processing, analysis and visualization of large ...
LinkedIn: https://www.linkedin.com/in/rick-dutta-527854192/ Instagram: ...
10 views


![Python Course for AI & Data Science [2026] - Part 2: Operators & User Input](/api/proxy/image?url=https%3A%2F%2Fi.ytimg.com%2Fvi%2F_OIpdIbeyUg%2Fsddefault.jpg)