Upload date
All time
Last hour
Today
This week
This month
This year
Type
All
Video
Channel
Playlist
Movie
Duration
Short (< 4 minutes)
Medium (4-20 minutes)
Long (> 20 minutes)
Sort by
Relevance
Rating
View count
Features
HD
Subtitles/CC
Creative Commons
3D
Live
4K
360°
VR180
HDR
743 results
To try everything Brilliant has to offer—free—for a full 30 days, visit https://brilliant.org/ArtemKirsanov/ The first 200 of you will get ...
891,790 views
2 years ago
How to make animated plot (animated chart) with Matplotlib and Python programming Language. In this tutorial, an animated plot ...
24,707 views
3 years ago
A behind-the-scenes look at how I animate videos. Code for all the videos: https://github.com/3b1b/videos Manim: ...
2,643,239 views
1 year ago
A bar chart race, also known as a bar chart animation or a bar chart race animation, is a data visualization technique that shows ...
6,092 views
Source code: https://gist.github.com/syphh/9fa861563977e2cbbf4ddea518677b0a Learn graph theory algorithms: ...
1,217 views
This program simulates inertia and surface tension. I made this program in the early 2000s, it was a java applet. I made this ...
58 views
4 years ago
In this video, we are going to learn about how to create a responsive bar chart animations in 3 lines of code using our favourite ...
726 views
Most of us have heard the saying, "A picture is worth a thousand words," but a movie builds context and a story, especially when ...
1,283 views
Speaker: Reshama Shaikh Plotly is a versatile, open-source python graphing library which lets us make interactive graphs.
104 views
In the ever-evolving world of data visualization, scatterplot animation has emerged as a captivating and powerful tool to breathe ...
172 views
In this simple demo, I have used Matplotlib to create a mp4 file which shows how gradient descent is used to come up with the ...
3,042 views
6 years ago
In the field of astronomy and astrophysics, data cubes are fundamental tools for analyzing three-dimensional data sets that ...
250 views
Visualization is central to the process of how we think. This video reviews the inner workings of Python's most popular plotting ...
3,752 views
5 years ago
A data cube in astronomy is a three-dimensional array of data, where two of the dimensions correspond to spatial information (like ...
380 views
This video is part of an online course, Interactive 3D Graphics. Check out the course here: https://www.udacity.com/course/cs291.
299 views
10 years ago
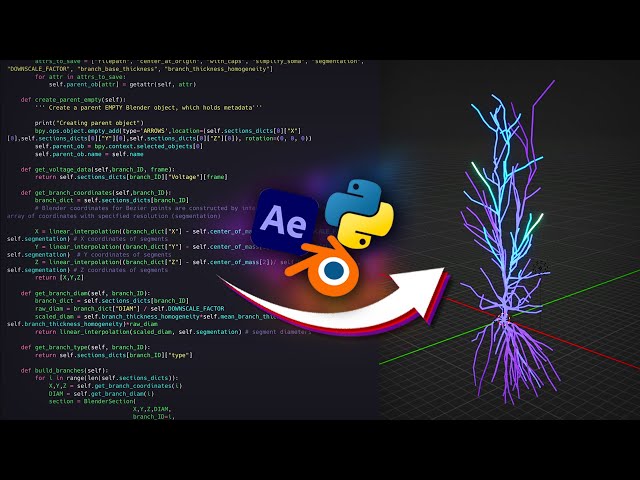
Struggling with Python in Blender? Go here: https://cgpython.com/skool/97 In this video, we will create a script that generates an ...
11,674 views
Matplotlib is used to customize visuals and create animation and Seaborn is used to create exploratory charts like Heat map ...
854 views
This program simulates inertia and surface tension. I made this program in the early 2000s, it was a java applet. I made a 1D ...
71 views
Python tkinter animation animations canvas tkinter GUI tutorial #Python #tkinter #animation #animations #canvas #GUI #tutorial.
57,811 views