ViewTube

ViewTube
Sign inSign upSubscriptions
Filters

Upload date

Type

Duration

Sort by

Features

Reset

308 results

Intellipaat
Data Analytics Full Course FREE | Data Analytics Course 2026 | Intellipaat

If you want to break into data analytics or strengthen your existing skills, this Data Analytics Full Course FREE by Intellipaat, ...

Live
Data Analytics Full Course FREE | Data Analytics Course 2026 | Intellipaat

47 views

0

CodewithPrashant
Python Data Visualization Tools

Top Python Data Visualization Tools You Should Know Turn raw data into powerful insights with Python's most popular ...

0:07
Python Data Visualization Tools

4,612 views

1 day ago

Sayyed Nasar Ali
Data Visualization with Matplotlib & Seaborn | Beginner Friendly

sayyednasarali #DataVisualization #Python #Matplotlib #Seaborn #DataScience #BeginnerPython #SchoolLevel #PythonTutorial ...

12:01
Data Visualization with Matplotlib & Seaborn | Beginner Friendly

47 views

5 days ago

Mind Shift Facts
Stop guessing — Seaborn or Matplotlib? Here’s the answer

Seaborn and Matplotlib are two of the most popular Python libraries for data visualization — but they serve different purposes.

0:53
Stop guessing — Seaborn or Matplotlib? Here’s the answer

0 views

2 days ago

Man Does Tech
How to Do Data Visualization in Python (easy Method)

How to Do Data Visualization in Python (easy Method) | Surfshark VPN Deal — Stay private and secure. $1.99/mo + 3 Months ...

1:50
How to Do Data Visualization in Python (easy Method)

0 views

4 days ago

Data Shift Lab
Customer Churn Analysis Using Python | EDA Project | Data Analysis for Beginners

In this video, you'll learn Customer Churn Analysis using Python through a complete Exploratory Data Analysis (EDA) project.

25:24
Customer Churn Analysis Using Python | EDA Project | Data Analysis for Beginners

6 views

4 days ago

NeuralMinds
Seaborn for Data Visualization | Scatter, Line, Box Plot & Pairplot Explained | @NeuralMinds3

Seaborn for Data Visualization | Scatter, Line, Box Plot & Pairplot Explained | ⁨@NeuralMinds3⁩ Welcome to NeuralMinds!

26:49
Seaborn for Data Visualization | Scatter, Line, Box Plot & Pairplot Explained | @NeuralMinds3

13 views

3 days ago

Tenor Tech Tutorials
How to Use Python for Analysis (only Way)

How to Use Python for Analysis (only Way) | Surfshark VPN Deal — Stay private and secure. $1.99/mo + 3 Months Free ...

1:48
How to Use Python for Analysis (only Way)

0 views

4 days ago

Tamim Ekbal
Ice Cream Sales Predictor | Linear Regression Project using Scikit-Learn | T

Ice Cream Sales Predictor | Linear Regression Project using Scikit-Learn Ever wondered if we can predict business revenue ...

3:52
Ice Cream Sales Predictor | Linear Regression Project using Scikit-Learn | T

2 views

10 minutes ago

MizuFlow
The 5 Essential Python Libraries for Data Science in 2025: NumPy, Pandas, SciPy & More

In this MizuFlow.ai Foundation of Finance episode, Sung Lee, CFA, CPA, CA, provides an extensive overview of the foundational ...

5:40
The 5 Essential Python Libraries for Data Science in 2025: NumPy, Pandas, SciPy & More

0 views

4 days ago

WhizzStep
Python_for_Artificial_Intelligence
2:20
Python_for_Artificial_Intelligence

0 views

4 days ago

MachineLearnAthon
Tutorial on Data preparation and visualization

Get started with data analysis in Python using Jupyter Notebook! This tutorial introduces essential libraries — NumPy, pandas, ...

11:25
Tutorial on Data preparation and visualization

0 views

1 day ago

LetsUpgrade
Exploring the Titanic Dataset: Feature Engineering & ML in Python for Beginners

Mark Attendance & Submit Assignment at One Place → https://luc.to/tddec25d1 Join Data Science with Python Discussion group ...

1:00:25
Exploring the Titanic Dataset: Feature Engineering & ML in Python for Beginners

236 views

5 days ago

Durga Software Solutions
PYTHON with AI (CORE & ADVANCED) Class Room Training @ DURGASOFT

PYTHON with AI (CORE & ADVANCED) Class Room Training @ DURGASOFT ...

0:35
PYTHON with AI (CORE & ADVANCED) Class Room Training @ DURGASOFT

33 views

3 days ago

Techmedbuddy
The Ultimate Guide to Descriptive Statistics (5-Hour structured Program)

Introducing: Descriptive Statistics (5-Hour Program) Build a strong foundation in Descriptive Statistics with this 5-hour structured ...

1:26
The Ultimate Guide to Descriptive Statistics (5-Hour structured Program)

7 views

3 days ago

Learn with Suba
VISUALIZATION | PYTHON PROGRAMMING |  SNSINSTITUTIONS

NumPy itself does not create graphs, but it is the foundation for data visualization in Python. Visualization libraries like Matplotlib, ...

5:12
VISUALIZATION | PYTHON PROGRAMMING | SNSINSTITUTIONS

0 views

5 days ago

Tuta Tech
Funnel Analysis Project for Job 🚀 | First on YouTube | Data Analytics Project | Tuta Tech

File Link :- https://drive.google.com/file/d/1j6oYthF5VUSX_AKu_EKfIQpDkAbbb2Vm/view?usp=drive_link Instagram Link ...

2:01:45
Funnel Analysis Project for Job 🚀 | First on YouTube | Data Analytics Project | Tuta Tech

126 views

2 days ago

Linux Plumbers Conference
Python-BPF: Writing eBPF programs in pure Python - Pragyansh Chaturvedi, Mr Varun Mallya

Python-BPF: Writing eBPF programs in pure Python - Pragyansh Chaturvedi, Mr Varun Mallya (Indian Institute of Technology, ...

33:13
Python-BPF: Writing eBPF programs in pure Python - Pragyansh Chaturvedi, Mr Varun Mallya

48 views

5 days ago

Durga Software Solutions
PYTHON with AI (CORE & ADVANCED) Online Training @ DURGASOFT

PYTHON with AI (CORE & ADVANCED) Online Training @ DURGASOFT ...

0:35
PYTHON with AI (CORE & ADVANCED) Online Training @ DURGASOFT

12 views

3 days ago

ECOVISION ACADEMY
MULTIVARIATE ANALYSIS USING SEABORN

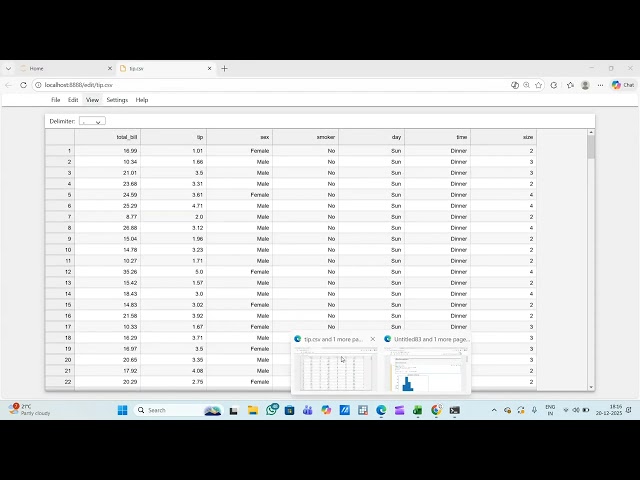
Multivariate analysis using cbond library in Python we have a data set here the name of the data set is tips and in this tip data set ...

3:47
MULTIVARIATE ANALYSIS USING SEABORN

0 views

3 days ago